Four common Statistical Test ideas to share with your academic colleagues
As researchers, one task we are all engaged in is choosing the appropriate statistical test for our analysis and data. Choosing the appropriate test is key since our findings, interpretations, and recommendations will be based on the analyses we conduct. It is important to understand what the different tests do, and what to include when reporting your results. Below is a brief overview of some parametric tests along with the assumptions that need to be met in order to use that test. Later in the blog, I provide an overview of some nonparametric tests. In the last part of the blog, you will see what you should include when reporting the findings for each of these tests.
1. T-Tests
Paired t-tests are used to compare two variables from the same population. For example, a pre and post score from the same group or a score taken from the same group under different conditions. The purpose of the test is to ascertain whether there is statistical evidence that the mean difference between observations on a specific outcome is significantly different from zero. These t-tests are also known as the repeated measures t-test or the dependent t-test. There are certain assumptions that your data must meet in order to use this test: the dependent variable must be continuous, the subjects in each condition must be the same, the difference between pair measures must be normally distributed and contain no outliers. Independent t-tests are used to look at the difference between two different groups. In other words, this test compares means for two different groups. This test assumes that the dependent variable must be continuous and that the independent variable is categorical. There can be no relationship between the subjects in each sample. The independent variable for each sample is normally distributed and the variance is approximately equal across groups.
2. Analysis of Variance (ANOVA)
The t-tests described above have several limitations. You can only compare two means and they can only be used with one independent variable. Analysis of Variance (ANOVA) compares several means and can be used when you have manipulated more than one independent variable. ANOVA tests the null hypothesis that all the means are the same. With ANOVA the research question we are asking is: is there a difference between the means of our groups after treatment? Therefore, the statistical question is: do the means of the sample differ more than you would expect if the null hypothesis were true? The test statistic for an ANOVA test is the F statistic. This compares the Between-Group Variance (this is the variation between sample means) to the Within-Group Variance (the variation within each sample). Under the null hypothesis these would be basically equal. Assumptions that must be made for using ANOVA are: each group sample is drawn from a normally distributed population; all populations have a common variance; samples are drawn independently of each other; and observations are sampled randomly.
3. Correlation and Regression
A fundamental goal of science is to identify reliable relationships between variables. In correlation, the two variables are symmetric. It does not matter which is the dependent or independent variable. In simple regression, one of the variables is designated as the dependent variable and one is called the independent variable, which is sometimes called the explanatory variable. In multiple regression, there will be more than one independent variable. Correlation coefficients measure the strength of the relationship between two variables. Pearson correlation is one of the most common correlation coefficients. Regression analysis is a set of statistical processes for estimating the relationships between a dependent, or outcome variable and one or more independent variables, often called predictors. Basically, regression analysis answers the following kinds of questions: “How much variance in Y is accounted for, or explained by the X variable? When X changes by one unit, by how many units does Y change? When the student spends one more hour studying the weekend prior to an exam, by how many points does her test score change?” Using regression analyses we can craft predictions by fitting a graph to a set of data and using that graph to make predictions. Simple regression is a way of predicting values of one variable by using another. We do this by fitting a statistical model to the data in the form of a straight line. The line is the line that best summarizes the pattern of the data. We have to assess how well the line fits the data. In a regression analysis, R-squared is the proportion of variance in the outcome variable that is shared by the predictor variable. The b-value tells us the gradient of the regression line and the strength of the relationship between a predictor and the outcome variable.
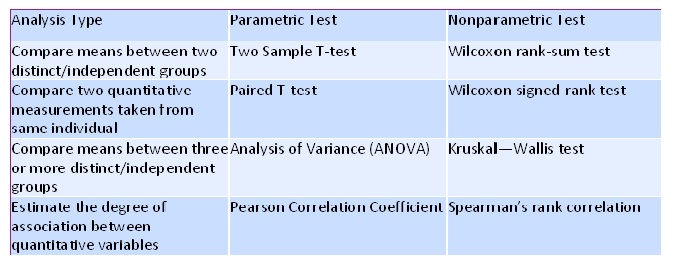
4. Nonparametric Tests
When you design a research study and gather data, you first need to make sure that you can met the assumptions for a parametric test. Because parametric tests are more powerful, we aim to use them when possible. However, if we cannot meet the assumptions for a parametric test, we can use a nonparametric test. The table below outlines nonparametric tests that can be used in place of a specific parametric test.
When you run a test in your statistical software program the following steps occur:
✦ The test statistic is calculated. Basically, the test statistic describes how much the relationship between variables differs from the null hypothesis (no relationship). There are different test statistics for each test.
✦ Next, the p-value is calculated. This is the probability that you would see the difference described by the test statistic if the null hypothesis were true, in other words if there were no relationship.
✦ If the value of the test statistic calculated is more extreme than that calculated from the null hypothesis, there is a statistically significant relationship.
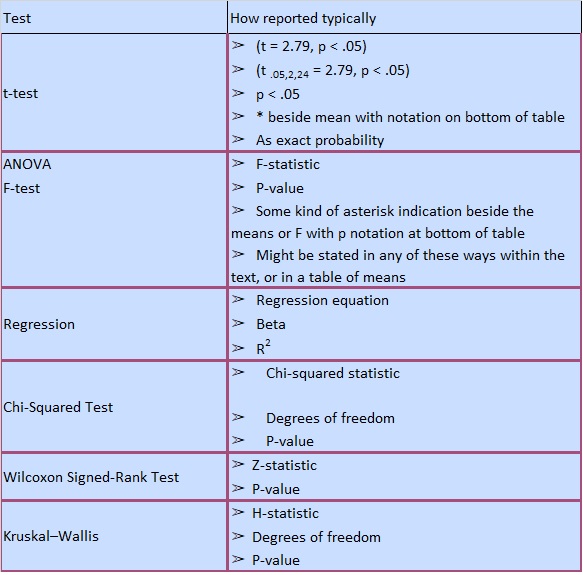
Once you have completed your analyses, you are ready to include results and report your findings. The table below outlines how results from a specific test are reported and can be useful when you are writing an academic paper or preparing a presentation.
Maximise your publication success with Charlesworth Author Services.
Charlesworth Author Services offers offering statistical analysis for researchers in the field of medical and life sciences articles. This service will help the researcher improve the accuracy and reporting of their data prior to submitting their article to a publisher.