The different classifications followed by journals
Scientific journals are classified and ranked, and these classifications and rankings are key for authors, publishers and journal editors. The ranking of journals is common in academia and journal rankings count when a researcher is putting forward their file for retention, tenure and promotion. Researchers aim to publish in top-tier and high-ranking journals. So it is important for them to know how a journal is classified and ranked. This helps them when choosing a journal to which they will submit their work. Publishers and editors are interested in the ranking for their journal because high-tier journals attract more seasoned and prolific authors.
Scientific institutes
There are a variety of scientific institutes around the world that classify journals using certain criteria related to the journal major field and citation impact. Journal rankings place a journal in comparison to other journals in the same field. Scimago Journal and Country Rank (SJR) develops journal rankings and uses the Scopus database. This platform takes its name from the SCImago Journal Rank (SJR) indicator, developed by SCImago from the widely known algorithm Google PageRank™. The SJR measure incorporates both the number of citations received by a journal and how prestigious or high tier the journal of originating citations is. You can search journals using a number of filters.
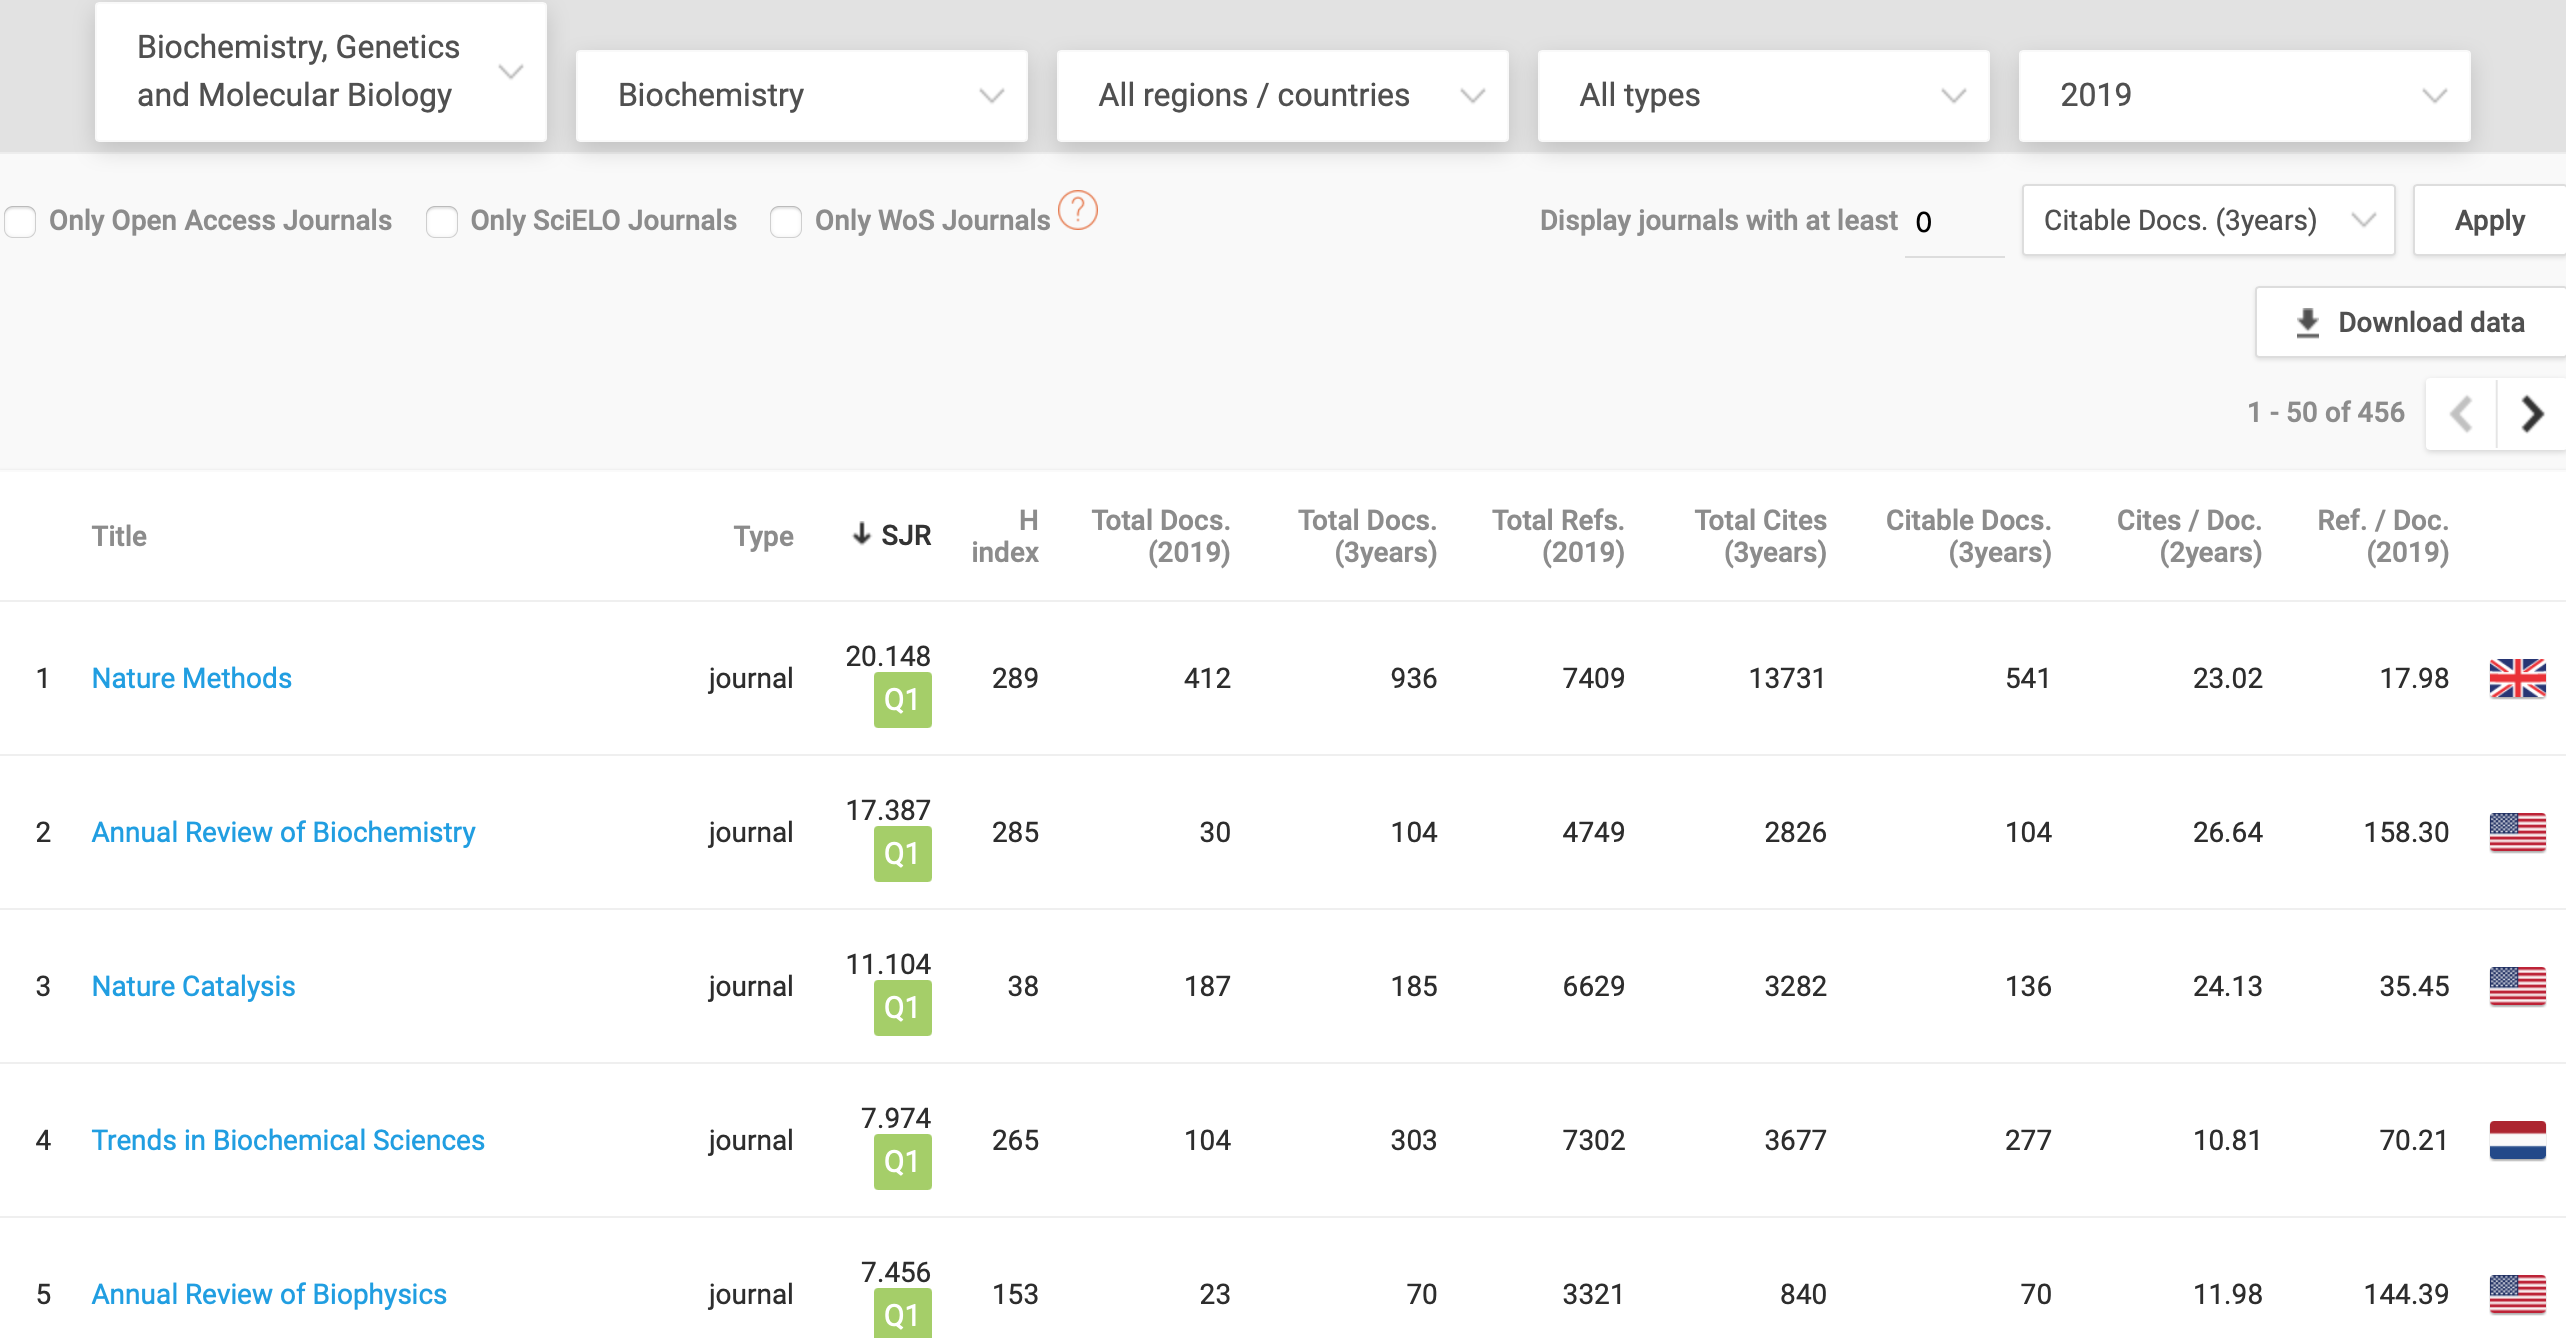
Quartiles
Journals are also categorised into four quartiles: Q1, Q2, Q3 and Q4. Journals in Q1 and Q2 are considered top-tier journals while the lower-tier journals are classified as Q3 and Q4. Q1 and Q2 journals have a higher impact factor than Q3 and Q4 ranked journals. Some of the factors considered in the categorisation include the aim and scope of the journal, the quality of its board, the impact factor, external opinions about the journal and quality of the papers.
The number of citations for journal publications is an influencing factor, called the impact factor, which is used to rank journal ranks. Several journal-level metrics have been developed. The majority of these are based on citations.
Impact factor and CiteScore
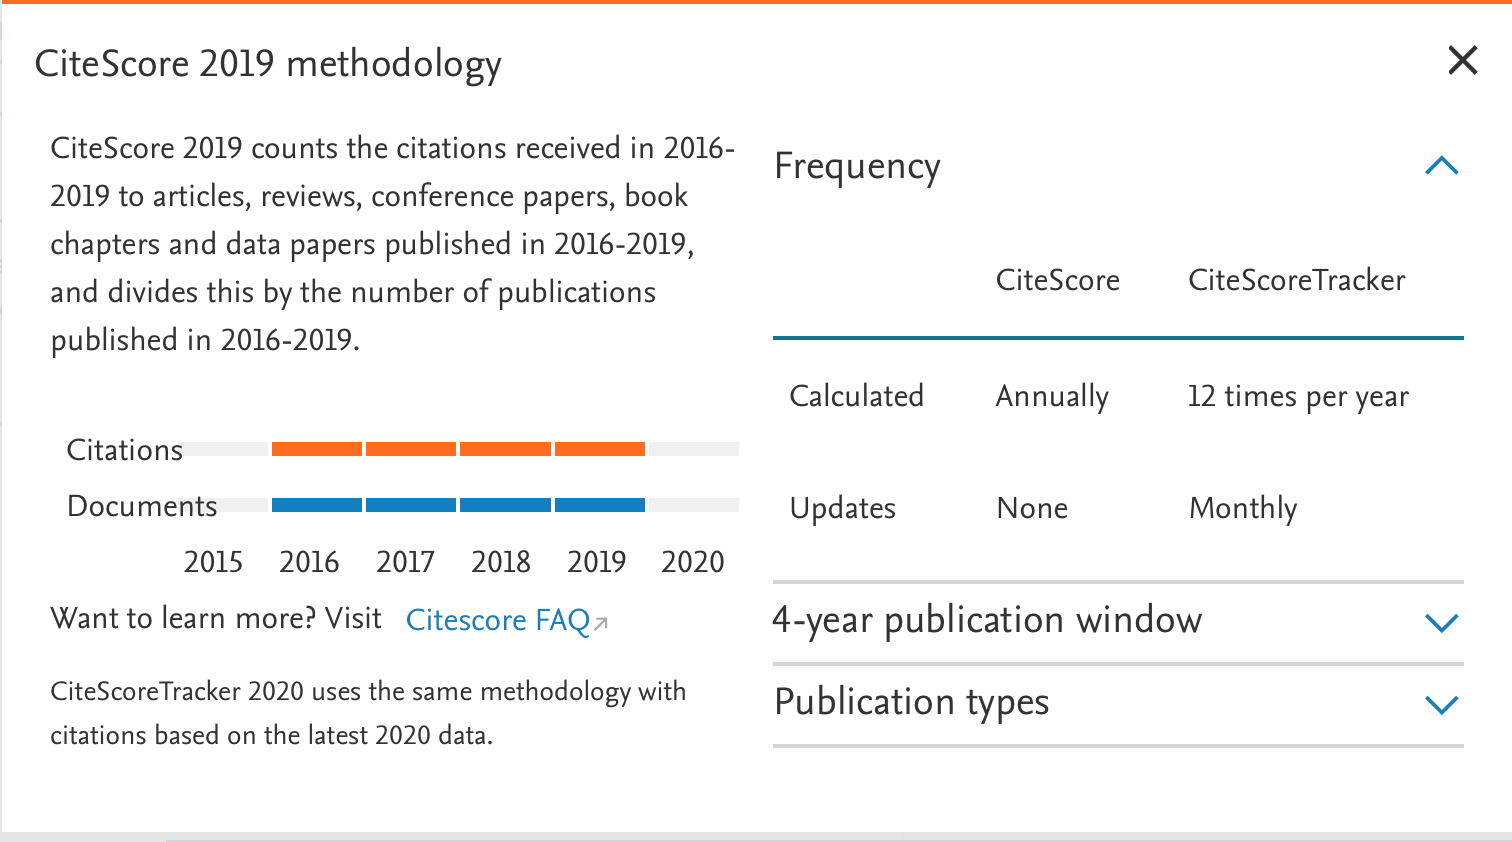
The impact factor is a measure of the frequency with which the average article in a journal has been cited in a specific year. The calculation is conducted by dividing the number of times articles were cited by the number of citable articles. CiteScore was developed in 2016 by Elsevier. It reflects the yearly average number of citations of recent articles published in that journal. CiteScore is based on the citations recorded in the Scopus database and citations are collected for articles published in the preceding four years instead of two or five. CiteScore methodology is outlined on the Scopus website:
Eigenfactor
Eigenfactor is a freely available rating using the number of incoming citations, with citations from highly ranked journals weighted to make a larger contribution to the eigenfactor than those from lower-tier journals. According to their website,
“We aim to use recent advances in network analysis to develop novel methods for evaluating the influence of scholarly periodicals, for mapping the structure of academic research, and for helping researchers navigate the scholarly literature. We are committed to broadly disseminating our research findings and technological developments, while respecting the confidentiality of the data sources we use” (http://eigenfactor.org/about.php).
Alternative metrics
As scholarship has moved online and the Open Access movement has gathered momentum, there is growing consensus that alternative metrics are needed. A variety of research metrics are in current use, and the number of different metrics is growing every day. Alternative metrics are being utilised that look at more than citations, such as how often someone’s work is mentioned in the news, via blogs or on Twitter. These alternative metrics, commonly called altmetrics, are complementary to traditional, citation-based metrics. These can also include the number of downloads and online views of an article that has been posted on a website or shared through an institutional repository.
Altmetrics are metrics and qualitative data that are complementary to traditional, citation-based metrics. They can include (but are not limited to) peer reviews on Faculty of 1000 (F1000), citations on Wikipedia and in public policy documents, discussions on research blogs, mainstream media coverage, bookmarks on reference managers like Mendeley, and mentions on social networks such as Twitter.
Source normalised impact per paper (SNIP)
SNIP is a factor released in 2012 by Elsevier based on Scopus to estimate impact. SNIP weights citations based on the total number of citations in a subject area. Therefore, citations in subject areas where citations are less likely are given higher value. SNIP corrects for variation in citation practices between disciplines.
“SNIP was revised in 2012 to include these indicators:
- P – the number of publications of a source in the past three years.
- RIP – the raw impact per publication, calculated as the number of citations given in the present year to publications in the past three years divided by the total number of publications in the past three years. RIP is fairly similar to the well-known journal impact factor. Like the journal impact factor, RIP does not correct for differences in citation practices between scientific fields.
- SNIP – the source normalized impact per publication, calculated as the number of citations given in the present year to publications in the past three years divided by the total number of publications in the past three years. The difference with RIP is that in the case of SNIP citations are normalized in order to correct for differences in citation practices between scientific fields. Essentially, the longer the reference list of a citing publication, the lower the value of a citation originating from that publication. A detailed explanation is offered in our scientific paper.
- % self-citations – the percentage of self-citations of a source, calculated as the percentage of all citations given in the present year to publications in the past three years that originate from the source itself.” (https://lib.guides.umd.edu/bibliometrics/SNIP)
Conclusion
As a researcher and author, knowing how to interpret the rankings of journals is very important. Take some time to explore the different ways in which journals are ranked so you understand what the rankings mean.
Charlesworth Author Services, a trusted brand supporting the world’s leading academic publishers, institutions and authors since 1928.
To know more about our services, visit: Our Services
Visit our new Researcher Education Portal that offers articles and webinars covering all aspects of your research to publication journey! And sign up for our newsletter on the Portal to stay updated on all essential researcher knowledge and information!
Register now: Researcher Education Portal
Maximise your publication success with Charlesworth Author Services.